
Stock charts can feel overwhelming to newcomers. With jagged lines, complex indicators, unfamiliar acronyms, and seemingly endless data points, they might seem like tools reserved for professional analysts. But here’s the truth: you don’t need a finance degree or a Wall Street job to read and understand a stock chart.
With a basic understanding of how these charts work, anyone can begin to decode them and use them to make better investment decisions. Stock charts are simply visual narratives of how a stock has moved over time. They can reveal trends, showcase momentum, and even hint at potential reversals. Whether you’re investing for the long haul or just getting started, understanding stock charts can give you a valuable edge.
This guide will walk you through the essential components of a stock chart, highlight key indicators, and provide actionable tips—so you can interpret charts confidently and independently. We’ll also clear up common misconceptions, introduce tools to help you get started, and suggest what to explore next as you grow your skills.
1. Understanding the Axes
Every chart has two axes that form its foundation:
- Horizontal Axis (X-Axis): This shows time. Depending on the chart, it might range from hours and days (for traders) to months and years (for long-term investors). Most charting tools let you adjust the time frame to match your investing style.
- Vertical Axis (Y-Axis): This represents the stock’s price. It charts how the value of a stock has changed over your selected time range.
Some platforms also let you switch between a linear scale (equal price increments) and a logarithmic scale (equal percentage changes), which can be useful for visualizing large price swings over long time periods.
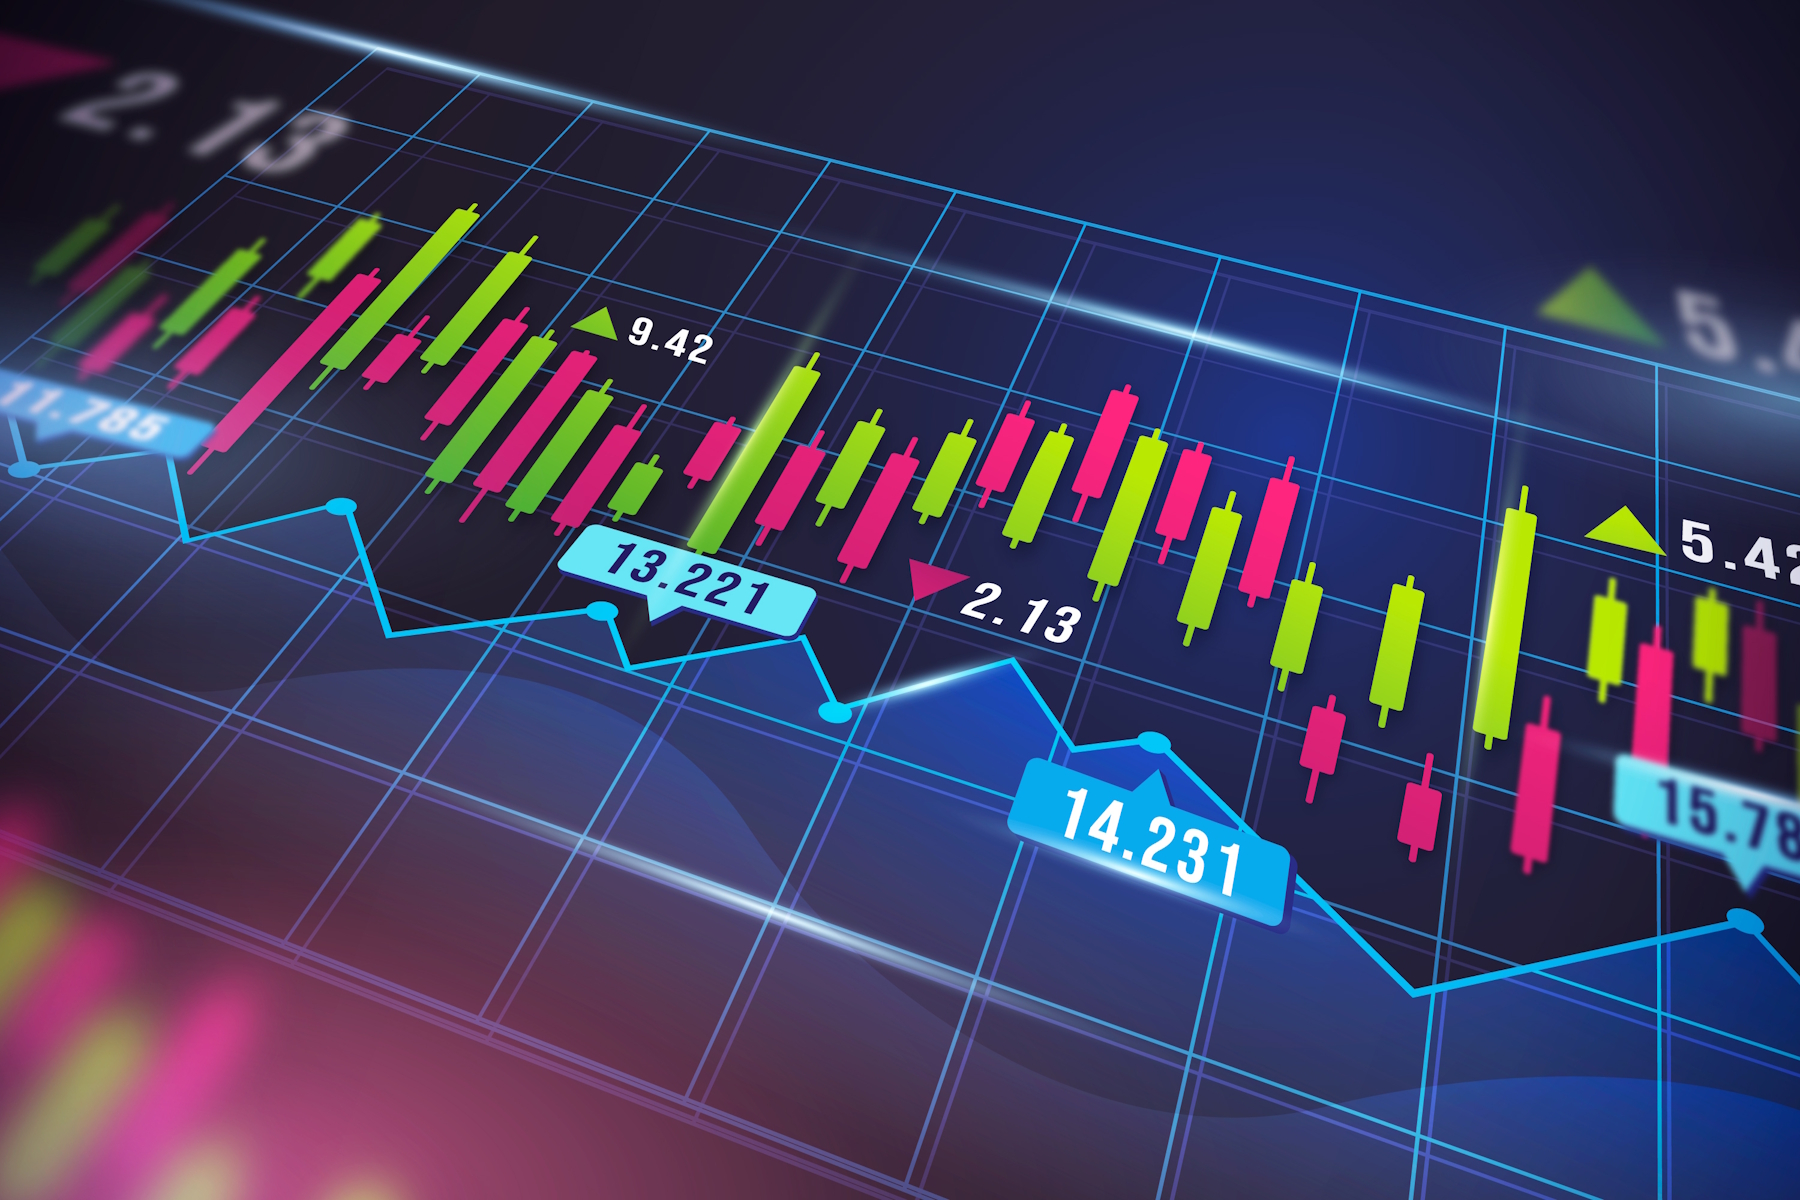
2. Line vs. Candlestick Charts
There are many types of charts, but two stand out:
- Line Charts: These connect the closing prices of each trading session with a simple line. They’re straightforward, clean, and excellent for beginners who want to track general trends.
- Candlestick Charts: These are more detailed. Each “candle” shows the stock’s opening, closing, high, and low price for a given time period. The body of the candle is colored—often green for a gain and red for a loss. Wicks (or shadows) indicate intraday price extremes.
Candlestick charts can be intimidating at first, but they’re incredibly insightful once you get the hang of them. Many traders use them to spot market psychology and short-term opportunities.
3. Volume Bars
Underneath most price charts, you’ll find volume bars. These represent the number of shares traded during each period.
- High volume usually means heightened interest, whether due to earnings reports, news, or investor excitement.
- Low volume may suggest uncertainty or lack of conviction.
Volume spikes that accompany price changes are often more meaningful than price moves alone. If a stock surges on high volume, for example, it may confirm strong buying interest.
4. Identifying Trends
Trends help investors align with the market’s current mood:
- Uptrend: A series of higher highs and higher lows—bullish momentum.
- Downtrend: A sequence of lower highs and lower lows—bearish sentiment.
- Sideways Trend: Price moves within a tight range—market indecision or consolidation.
Spotting a trend early can help you make more informed entry and exit decisions. Use trendlines or moving averages to visualize the trend clearly.
5. Key Indicators to Know
Technical indicators offer more depth to your chart analysis. Start with these essentials:
- Moving Averages: These smooth out price data to reveal the overall direction. Common types include the 50-day and 200-day moving averages. A crossover (e.g., the 50-day crossing above the 200-day) is often viewed as a bullish signal.
- Support and Resistance: Support is a price level where buyers tend to enter, preventing the price from falling further. Resistance is where sellers step in, halting upward movement. Watching these levels helps with timing trades.
- RSI (Relative Strength Index): This momentum oscillator ranges from 0 to 100. An RSI over 70 often indicates an overbought condition; below 30, it may be oversold.
- MACD (Moving Average Convergence Divergence): This helps detect shifts in momentum by comparing two moving averages. It’s popular for identifying potential reversals.
You don’t need to master every tool at once. Start simple, build confidence, and gradually incorporate more advanced techniques.
6. News and Events Matter
Charts reflect what is happening, but not why. Always pair your technical analysis with news and context:
- Earnings releases, dividend announcements, or product launches can move stocks sharply.
- Economic data like inflation rates or employment figures influence entire markets.
- Geopolitical events, such as wars or elections, often create volatility.

By checking financial news platforms like Bloomberg, CNBC, or Reuters alongside your charts, you’ll better understand price movements and avoid getting caught off guard.
7. Chart Patterns to Watch
Experienced traders often recognize patterns that hint at what might come next:
- Head and Shoulders: Signals a potential trend reversal.
- Cup and Handle: Often precedes a breakout move.
- Double Tops/Bottoms: Suggests strong support or resistance.
- Flags and Pennants: Indicate a pause before the trend resumes.
While no pattern guarantees results, recognizing them gives you another lens through which to evaluate opportunities.
Conclusion
Reading stock charts is a skill anyone can learn. You don’t have to decode every technical nuance or use every indicator from day one. Start with the basics—understand the axes, learn to recognize trends, and get comfortable with line and candlestick charts.
As your confidence grows, add layers: incorporate volume analysis, key indicators, and pattern recognition. Pair what you see with current events, company news, and broader market sentiment. Over time, these tools will help you make decisions rooted in insight rather than emotion.
The stock market tells a story—and the chart is its voice. The more you listen, the more fluent you’ll become. So open up a chart, pick a stock you follow, and begin your journey toward becoming a more informed investor.