
Every developer, no matter how experienced, faces the dreaded bug. These sneaky little issues can pop up unexpectedly, causing your code to behave in mysterious ways. However, the ability to debug effectively is what sets great developers apart from the rest. Debugging isn’t just about finding and fixing errors; it’s a process that involves critical thinking, patience, and using the right tools and strategies to solve problems efficiently.
Whether you’re new to coding or a seasoned pro, improving your debugging skills can save you a lot of time and headaches. In this friendly guide, we’ll explore some tried-and-true techniques that will help you find and fix bugs like a pro. From understanding error messages to using debugging tools, you’ll learn how to approach bugs systematically, making the whole process much less stressful.
Table of Contents
- What is Debugging?
- Common Types of Bugs
- Setting Up for Success: Environment and Tools
- Debugging Techniques: Step-by-Step
- Using Debugging Tools
- Best Practices for Efficient Debugging
- Conclusion
1. What is Debugging?
Before we dive into techniques, let’s clarify what debugging actually is. Debugging is the process of finding and fixing issues (bugs) in your code. A bug can be anything that causes your program to behave unexpectedly—whether it’s a typo, logic error, or a more complex issue like a memory leak.
Think of debugging as detective work: you’re searching for clues (like error messages, logs, or unusual behavior), tracing them back to the problem, and then fixing the root cause. But unlike detectives, you have some powerful tools and strategies to help you along the way. The key to successful debugging is to stay calm, take things step by step, and not get overwhelmed when something goes wrong.
Why Does Debugging Matter?
Bugs are inevitable in software development. Even the most experienced developers write code with mistakes from time to time. Debugging is essential because:
- It improves the reliability and functionality of your program.
- It helps you understand your code better and why things went wrong.
- It saves time in the long run by catching small issues before they become big problems.
2. Common Types of Bugs
Bugs can come in many shapes and sizes. Knowing the most common types can help you spot them faster and fix them more efficiently. Here are a few you’ll likely encounter:
1. Syntax Errors
Syntax errors occur when your code doesn’t follow the rules of the programming language you’re using. It might be a missing semicolon, a misplaced bracket, or a typo in a keyword. These are usually the easiest bugs to spot because most programming environments will highlight the error for you.
2. Logic Errors
Logic errors happen when your code runs, but it doesn’t behave the way you expect. For example, you might have written a function to calculate the sum of two numbers, but it’s returning the wrong result. This type of bug can be tricky because the code might look correct but isn’t doing what you intended.
3. Runtime Errors
These bugs appear when your program is running. You might see an error message like “null reference” or “index out of bounds.” These errors occur due to invalid operations at runtime, like trying to divide by zero or accessing an element outside of an array’s range.
4. Performance Bugs
Performance bugs don’t necessarily break your code, but they make it run inefficiently. You might notice your application slows down or consumes too much memory or CPU. These bugs usually require some profiling and optimization to fix.
5. Compatibility Bugs
These bugs happen when your code works fine in one environment but fails in another. For example, something might work perfectly in Chrome but not in Firefox. It could also be related to different operating systems or versions of libraries.
3. Setting Up for Success: Environment and Tools
Before you even start debugging, it’s essential to have the right environment and tools in place. A good setup can save you tons of time and frustration.
1. Choose a Good IDE
A powerful Integrated Development Environment (IDE) like Visual Studio Code, IntelliJ, or PyCharm can make a huge difference. IDEs come with built-in features like syntax highlighting, error detection, and debugging tools that can help you find bugs more easily.
2. Version Control
Make sure you’re using a version control system like Git. This allows you to track changes, revert to earlier versions of your code if something goes wrong, and collaborate with others. Having a history of your code is crucial when debugging because you can see exactly what has changed and when a bug might have been introduced.
3. Use Linting Tools
Linting tools like ESLint (for JavaScript) or Pylint (for Python) analyze your code for potential errors and style issues. These tools catch mistakes before they even become bugs, helping you maintain cleaner, more reliable code.
4. Log Everything
One of the best ways to catch bugs is by adding logs to your code. Use logging libraries (like console.log() for JavaScript or print() for Python) to print out key variables and track the flow of your program. This helps you see what your code is doing at each step and spot where things go wrong.
4. Debugging Techniques: Step-by-Step
Now, let’s walk through a step-by-step debugging process that will help you efficiently track down and fix bugs.
1. Reproduce the Bug
The first step is to make sure you can consistently reproduce the bug. If you can’t reproduce it, it’s almost impossible to fix. Try running your program with different inputs or in different environments to see what triggers the bug. Once you can reproduce it, you’re already halfway there.
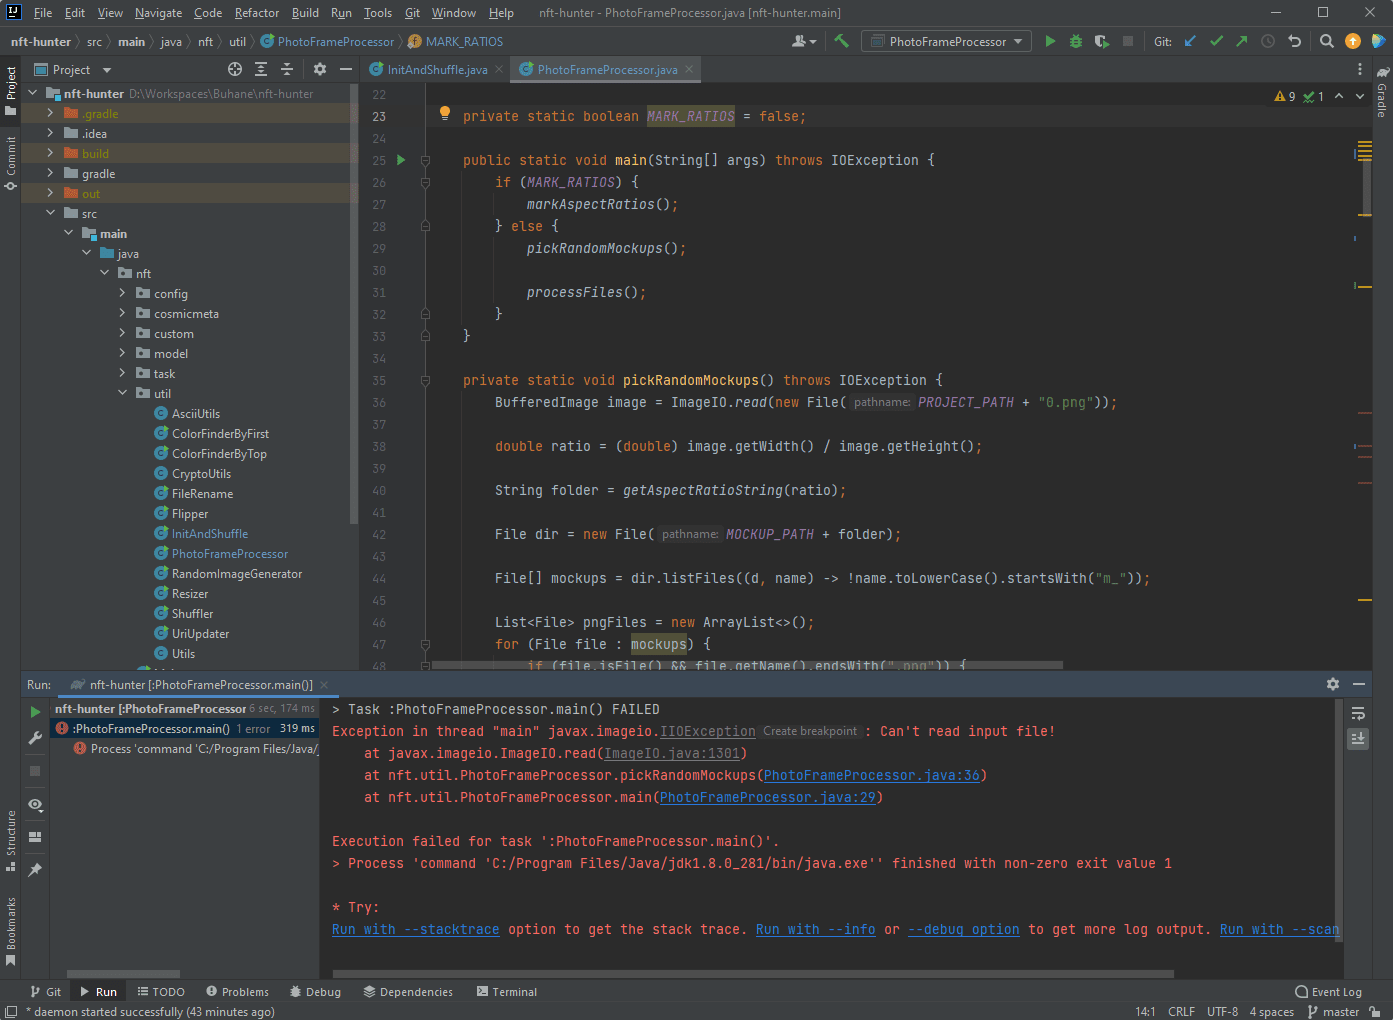
2. Read the Error Message (If Available)
If your program throws an error, pay close attention to the error message. These messages usually contain vital information, such as the type of error (e.g., TypeError, NullReferenceException) and the line number where it occurred. Start by understanding what the error is telling you and look at the line of code it references.
3. Simplify the Problem
Sometimes, bugs occur in complex parts of the program, making them hard to track. Try to simplify the problem by isolating the buggy section of code. If necessary, comment out parts of your code until you find the specific area causing the issue. Breaking down the problem into smaller pieces makes it easier to zero in on the bug.
4. Use Print Statements or Logs
Adding print statements (or logs) to your code is a simple but effective way to understand what’s going wrong. Print out the values of variables or the steps your code is going through. This helps you see if something unexpected is happening in the middle of your program. For example:
1 2 | # Python example print("User age is:", user_age) # Check if this variable is what you expect |
1 2 | // JavaScript example console.log("Order total:", totalAmount); // Is this value what you expected? |
5. Check Recent Changes
If your program was working fine earlier, try to think about what has changed since then. Have you added new code? Installed a new library? Small changes can often introduce unexpected bugs. Use Git to compare your current code with previous versions, and check when the bug might have been introduced.
6. Walk Through the Code
Take a deep breath and carefully walk through your code. Start from the section where the error occurs and trace backwards, making sure each part of your code behaves as expected. Try explaining each part of your code to yourself (or someone else). This “rubber duck debugging” method can often help you spot mistakes you may have overlooked.
5. Using Debugging Tools
While print statements and logs are useful, there are more advanced debugging tools that can take your debugging game to the next level.
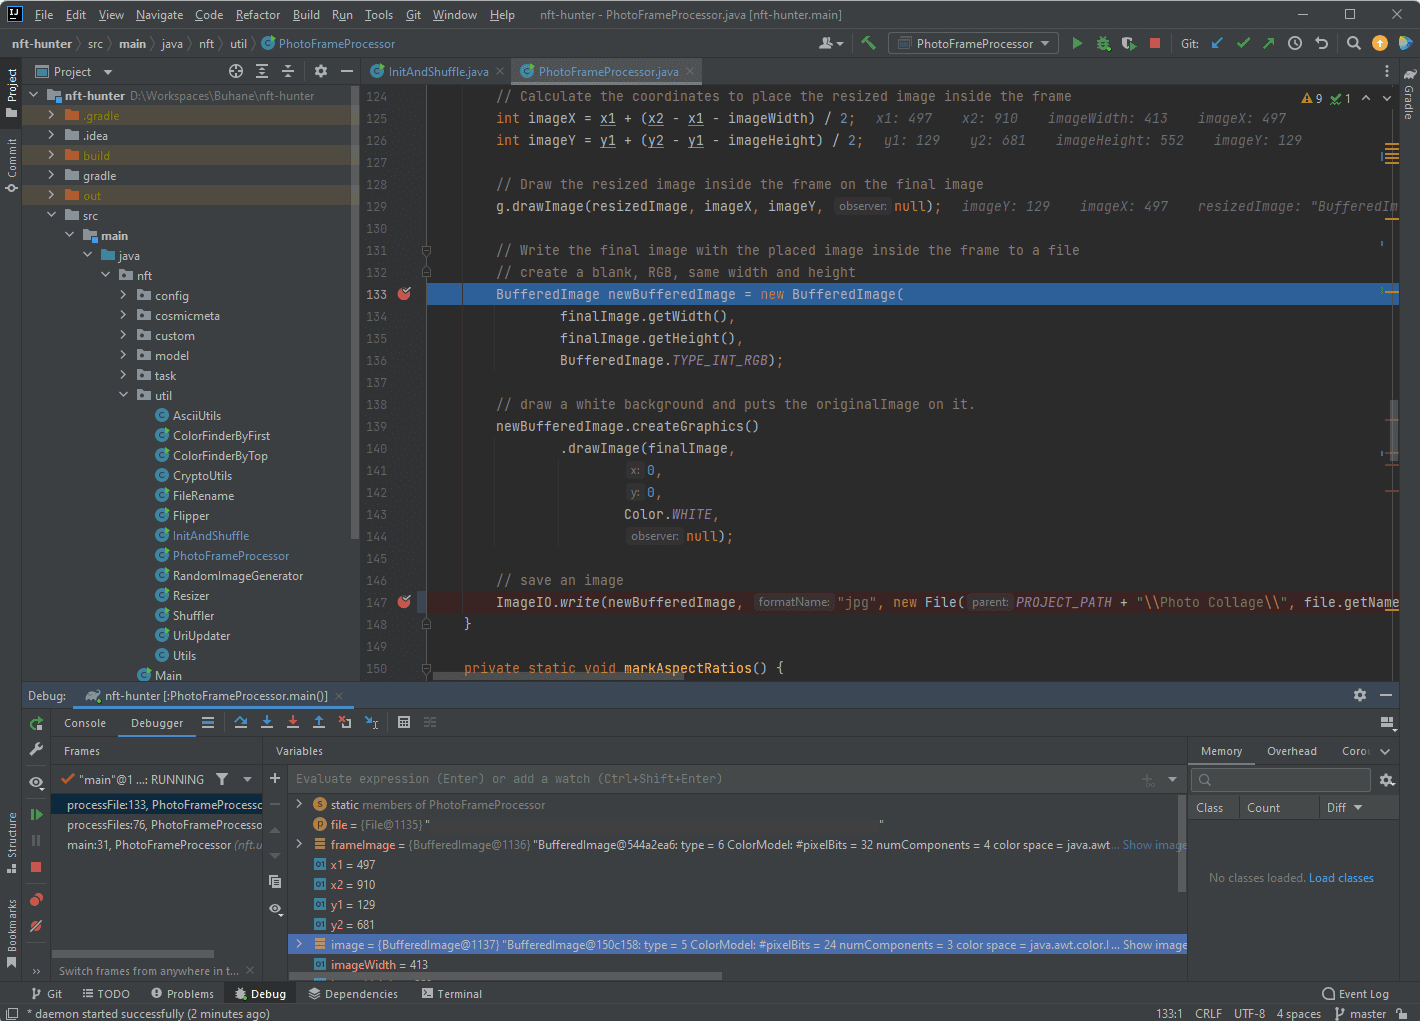
1. Breakpoints
Most IDEs let you set breakpoints, which pause the execution of your program at a specific line of code. When the program pauses, you can inspect the state of variables, the call stack, and more. This allows you to see exactly what’s happening at that point in your program and step through the code line by line.
2. Watch Variables
A watch list is a feature in many IDEs that lets you track the value of specific variables as your program runs. You can see how these values change over time and at different points in the execution, helping you pinpoint when a variable goes wrong.
3. Step-Through Execution
In addition to breakpoints, many IDEs let you “step through” your code. This means you can execute your program line by line, watching how it behaves at each step. This is particularly useful for debugging logic errors, as it helps you understand the flow of your program in detail.
4. Profiling Tools
If you’re dealing with performance bugs, profiling tools can be incredibly helpful. Tools like Chrome DevTools (for web development) or Python’s cProfile can show you where your program is spending the most time or using the most resources. This can help you identify bottlenecks and optimize performance.
6. Best Practices for Efficient Debugging
Now that you’ve learned about different debugging techniques, here are some best practices to make your debugging process as smooth as possible.
1.Stay Organized
When debugging, it’s easy to get lost in a sea of code. Take your time, and keep your thoughts and findings organized. Use comments in your code to note what you’ve tried, what worked, and what didn’t.
2. Take Breaks
Sometimes staring at code for too long can make you miss obvious mistakes. If you’re stuck, step away from your computer for a few minutes. Often, you’ll come back with fresh eyes and spot the bug right away.
3. Collaborate
If you can’t figure out the bug, don’t be afraid to ask for help. Sometimes, explaining the issue to a colleague or friend will give you a new perspective. Pair programming can also be a great way to solve tricky bugs.
4. Write Tests
Writing automated tests can help you catch bugs early and ensure that your code works as expected. Use unit tests to check small parts of your code and integration tests to check how different parts of your code work together. Testing your code regularly will reduce the number of bugs you encounter later.
5. Learn From Your Mistakes
Every bug is an opportunity to learn. Once you’ve fixed a bug, take a moment to understand why it happened and what you can do to prevent similar bugs in the future. This might involve improving your code structure, adding more tests, or being more cautious about recent changes.
7. Conclusion
Debugging may seem like a daunting task at first, but with the right mindset, tools, and techniques, you can become a pro at finding and fixing bugs. Remember, bugs are a normal part of the coding process, and every developer faces them. The key is to stay calm, break the problem down, and approach it systematically.
With these debugging strategies in your toolkit, you’ll be better equipped to tackle even the trickiest bugs. Debugging is a skill that improves with experience, so the more you do it, the faster and more effective you’ll become. Happy debugging!